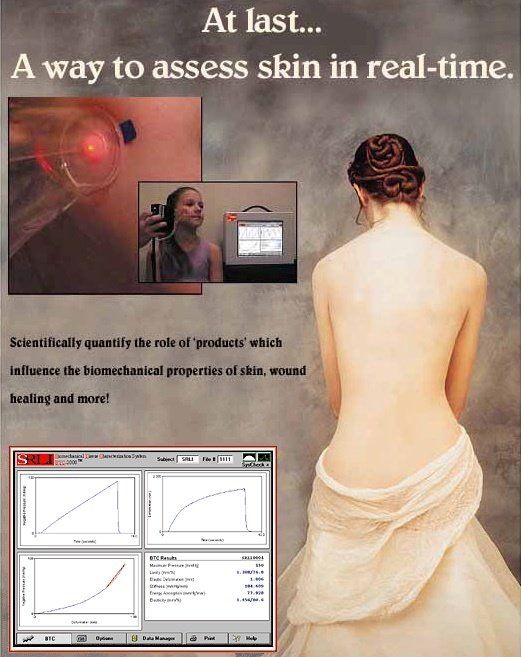
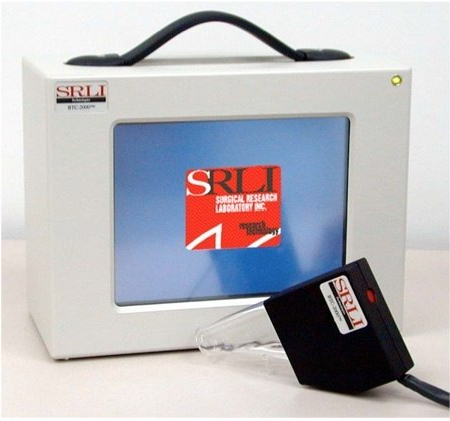
BTC-1000 (tm) Data Analysis Screen
BTC-1000TM  Data Analysis Screen  Measurement Parameters
 Gauge Length - Initial Distance (mm) between targets.

 Ultimate Pressure (shown in Pressure Graph) - Maximum amount of pressure (mmHg or kPa) applied, or required to induce failure.

 Best Fit Stiffness (shown in Pressure-Normalized Deformation Graph) - Stiffness (kPa) reflects the tissue's resistance to deformation, and is defined based on the slope of the linear elastic region in the Pressure-Normalized Deformation curve.

 Total Energy (shown in Pressure-Normalized Deformation Graph) - Energy Absorption (kPa) reflects the entire deformation response, thus depicts the tissue overall compliance or softness. The higher the Energy the more compliant or soft the material. The inverse, lower Energy response, demonstrates tissue firmness. Energy Absorption (kPa) represents the total area beneath the Pressure-Normalized Deformation curve.

 Linear Energy (shown in Pressure-Normalized Deformation Graph) - The Linear Energy (kPa) is the area under the Pressure-Normalized Deformation curve defined by the minimum and maximum cursors.

Go To: BTC-1000 Data Acquisition (DAQ) Screen          Return To: BTC-1000 Page

Copyright © 1998-2007 Surgical Research Laboratory, Inc.
All Rights Reserved.
U.S. Patent #5,278,776 & #5,379,235


Website Hosting and Maintenance by Media-Resources.com